
Why “Source of Truth” Matters, And Why Reporting Fail Without It
In every modern organization, dashboards and reports are supposed to be the sacred source of truth, the place where teams go to understand performance, make decisions, and align strategy. But for many companies, dashboards end up doing the opposite. Instead of providing clarity, they create confusion. Instead of building trust, they spark skepticism. Instead of unifying departments, they ignite debates over whose numbers are “right.”
Why?
Because a dashboard is only as trustworthy as the data behind it.
When your underlying data is inaccurate, duplicated, inconsistent, or poorly integrated, your dashboards are guaranteed to mislead. And when that happens, users stop trusting them altogether.
The Illusion of Insight: When Dashboards Look Good but Tell the Wrong Story
One of the biggest misconceptions in analytics is that a polished dashboard equals reliable insights. Beautiful charts, intuitive filters, or sleek UX can create a false sense of accuracy, but if the data pipeline feeding it is broken, none of it matters.
Poor data quality can come from:
- Missing or partial data (e.g., one system didn’t sync that morning)
- Duplicated records across CRM, marketing automation, and product logs
- Inconsistent business rules (sales uses a different definition of “active customer” than finance)
- Misaligned timestamps that make time series look out of sync
- Manual CSV uploads, the silent killer of trust and lineage
When these issues exist, the dashboard doesn’t describe reality. It describes a glitchy, fragmented version of it.
And that leads to the classic analytics failure mode:
Multiple Versions of the Truth
How “Multiple Versions of the Truth” Erodes Trust
When marketing, sales, finance, and product teams all see different numbers, the dashboard stops being a decision-making tool and becomes a weapon in arguments.
You’ve likely heard these before:
- “My pipeline metrics don’t match what the dashboard says.”
- “These revenue numbers look off — check your queries.”
- “Why does this report not match the one finance sent last week?”
- “Let me pull my own numbers — I don’t trust that dashboard.”
Once trust is broken, users abandon the dashboard. They revert to:
Manual spreadsheets
- Exporting raw data
- Creating shadow metrics
- Running their own queries
- Relying on anecdotal evidence
Nothing stalls data-driven cultures faster than people believing the dashboard is wrong.
The Real Cost: Decision-Making Slows and Politics Rise
When data is untrusted, accountability disappears. Teams spend more time validating numbers than acting on them. Leaders delay decisions. And people default to intuition because they don’t believe the data is reliable.
This creates a vicious cycle:
- Users doubt the dashboard
- Users stop adopting it
- Dashboard becomes outdated
- Stakeholders stop funding analytics improvement
Poor data quality isn’t just a technical issue; it’s a business risk that affects revenue, planning, and execution.
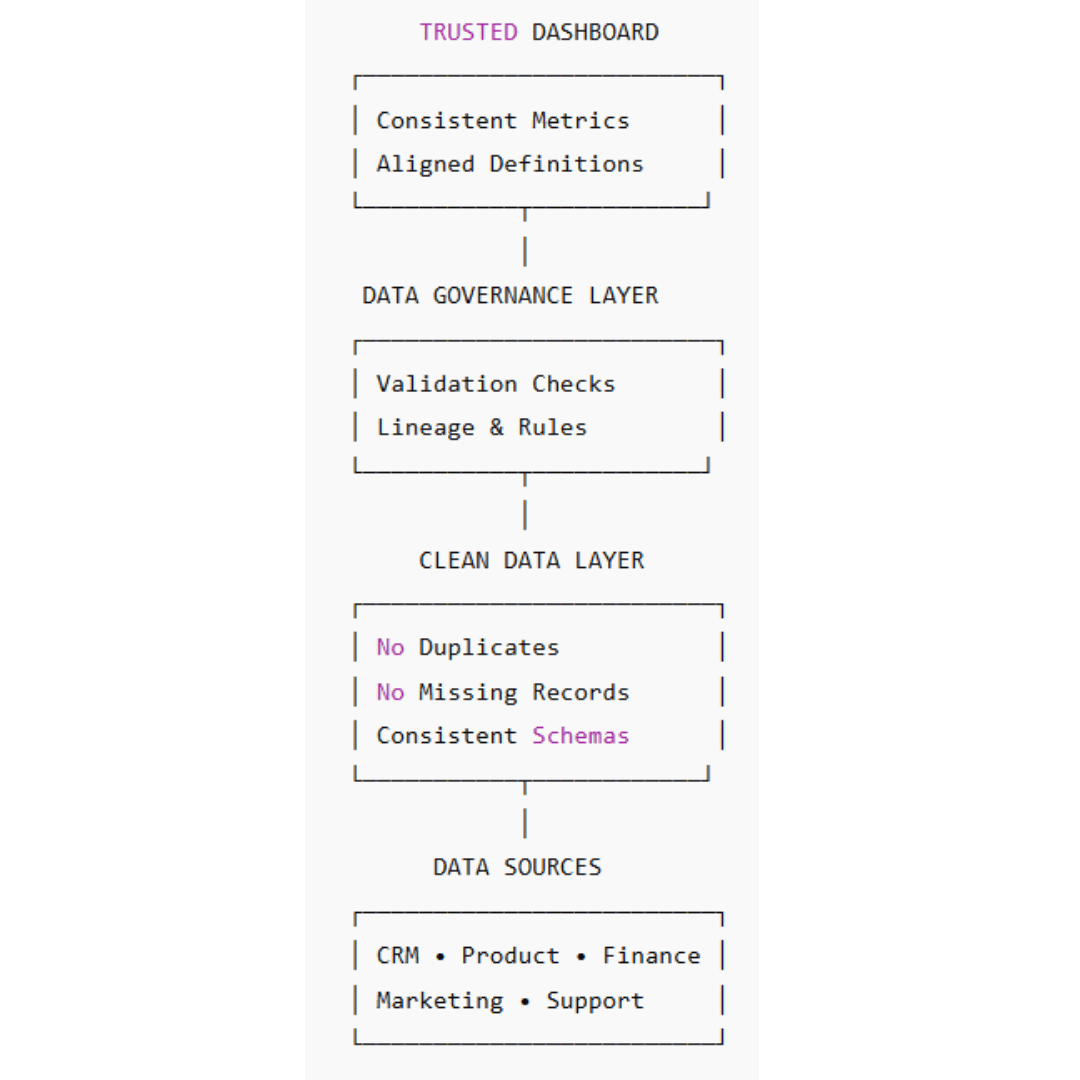
Fixing the Root Problem: Establishing a True “Single Source of Truth”
A real source of truth isn’t a dashboard. It’s the architecture underneath it.
To eliminate inconsistent reporting, organizations need:
1. Clear Data Definitions
Everyone must align on how metrics are calculated. A “customer,” “lead,” “active user,” or “churn” must mean the same thing across teams.
2. Rigorous Data Governance
Access controls, naming conventions, schemas, lineage—these protect data from accidental corruption.
3. Deduplicated, Clean, and Validated Data
Use ETL/ELT pipelines, DBT models, and automated quality tests to ensure inputs are correct before they hit the dashboard.
4. System Integration and Synchronization
Integrate CRM, marketing, finance, and product systems into a unified warehouse with consistent rules.
5. Automated Data Quality Monitoring
Run tests for freshness, uniqueness, volume, schema changes, and anomalies.
6. Transparent Lineage
Users should be able to see where each metric comes from — and how it’s calculated.
When these structures are in place, dashboards stop being fragile artifacts and become reliable operational tools.
Dashboards Should End Debates, Not Create Them
A dashboard cannot be your source of truth if the data isn’t. A KPI cannot be trusted if the pipeline behind it is broken.
And a report cannot be adopted if users see different numbers every time.
Trust is the foundation of analytics. Without it, nothing else matters, not the tool, not the visualization layer, not the design.
Build a strong data foundation first, and the dashboards will finally become what they were meant to be: a shared, trusted source of truth that drives better decisions across the business.
Based in Burbank, California, since 2015, Vimware is dedicated to supporting small to midsize businesses and agencies with their behind-the-scenes IT needs. As a Managed Service Provider (MSP), we offer a range of services including cloud solutions, custom programming, mobile app development, marketing dashboards, and strategic IT consulting. Our goal is to ensure your technology infrastructure operates smoothly and efficiently, allowing you to focus on growing your business. Contact us to learn how we can assist in optimizing your IT operations.